If you’ve ever debugged a production incident, you know the drill: IDE on one screen, Splunk on another, Sentry open in a third tab, frantically copying error messages between windows while your PagerDuty keeps buzzing.
You ask “What errors spiked in the last hour?” but instead of an answer, you have to context-switch, recall complex query syntax, and mentally correlate log timestamps with your code. By the time you find the relevant log, you’ve lost your flow. Meanwhile the incident clock keeps ticking away.
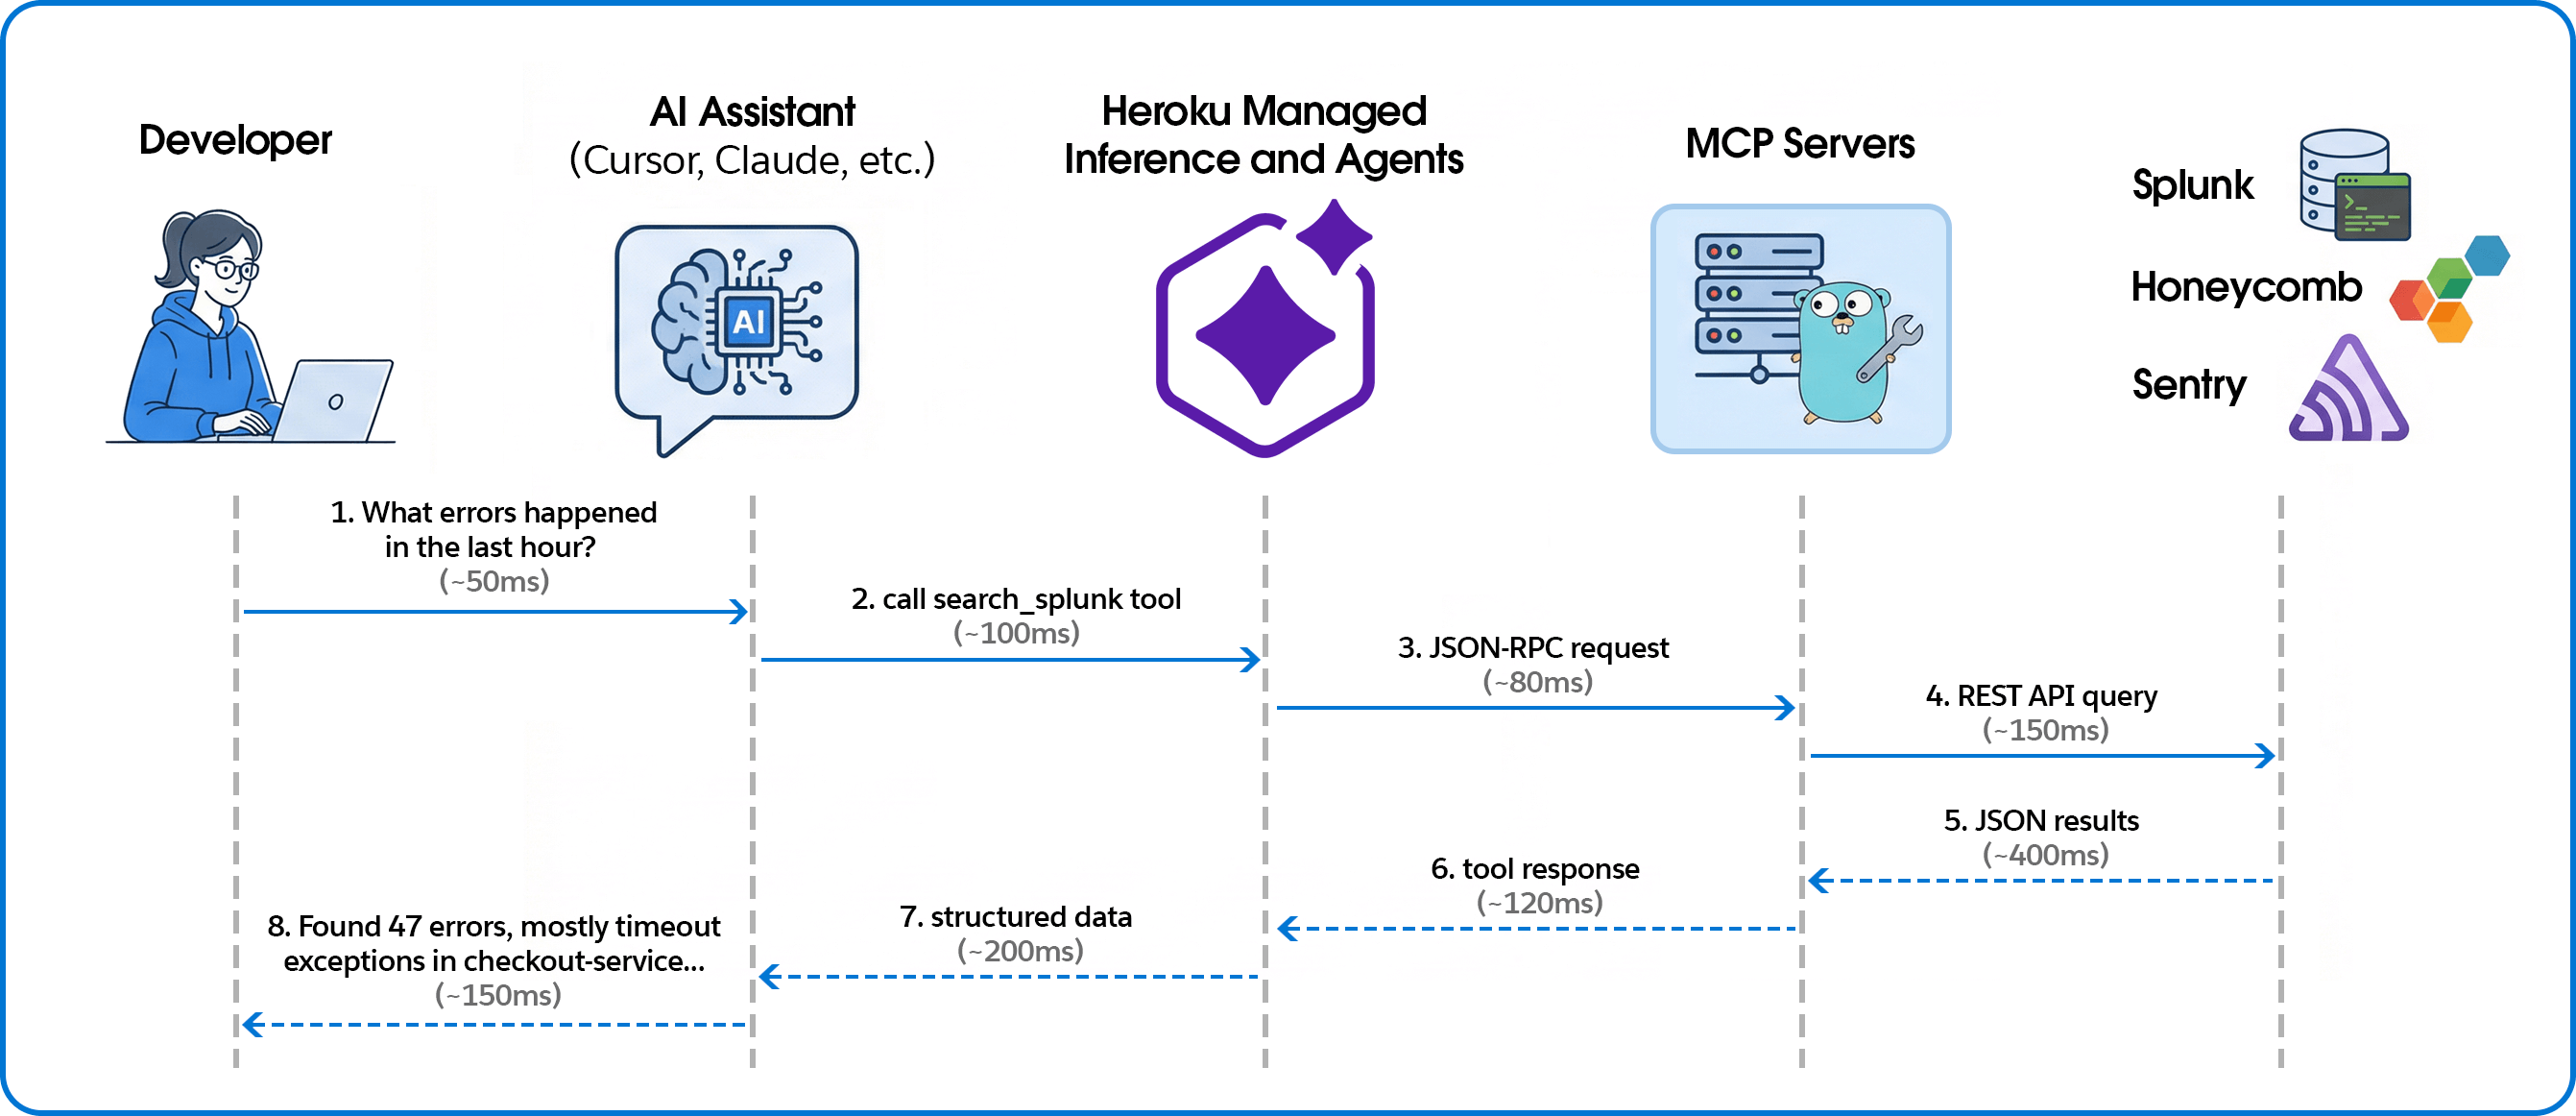
The workflow below fixes that broken loop. We’ll show you how to use the Model Context Protocol (MCP) and Heroku Managed Inference and Agents to pipe those observability queries directly into your IDE, turning manual hunting into instant answers.
Connecting telemetry to code for AI-powered observability
The system connects AI coding assistants to observability platforms through the Model Context Protocol (MCP), with Managed Inference and Agents handling the transport layer.
Building the MCP servers
Unified tool interface
We expose each observability platform through MCP’s consistent tool interface. Here’s how we define a Splunk search tool:
searchTool := mcp.NewTool("search_splunk",
    mcp.WithDescription("Execute a Splunk search query and return the results."),
    mcp.WithString("search_query", mcp.Description("The search query to execute")),
    mcp.WithString("earliest_time", mcp.Description("Start time for the search")),
    mcp.WithString("latest_time", mcp.Description("End time for the search")),
    mcp.WithNumber("max_results", mcp.Description("Maximum number of results")),
)
The AI assistant sees this as a callable tool with typed parameters. When a user asks about errors, the assistant decides which tool to call and constructs the appropriate arguments.
Handling tool calls
Tool handlers translate MCP requests into platform-specific API calls:
s.AddTool(searchTool, func(ctx context.Context, request mcp.CallToolRequest) (*mcp.CallToolResult, error) {
    searchQuery, _ := request.RequireString("search_query")
    earliestTime := request.GetString("earliest_time", "-24h")
    latestTime := request.GetString("latest_time", "now")
    maxResults := request.GetInt("max_results", 100)

    results, err := client.Search(ctx, searchQuery, earliestTime, latestTime, maxResults)
    if err != nil {
        return mcp.NewToolResultText(fmt.Sprintf("Error: %v", err)), nil
    }

    resultData, _ := json.Marshal(results)
    return mcp.NewToolResultText(string(resultData)), nil
})
Multi-platform support
The same pattern works across observability platforms. For Honeycomb, we expose dataset queries with filters and breakdowns:
queryTool := mcp.NewTool("query_honeycomb",
    mcp.WithDescription("Execute a Honeycomb query with filters and breakdowns"),
    mcp.WithString("dataset", mcp.Description("The dataset to query")),
    mcp.WithString("calculation", mcp.Description("COUNT, AVG, P99, etc.")),
    mcp.WithString("filter_column", mcp.Description("Column to filter on")),
    mcp.WithString("filter_value", mcp.Description("Value to filter for")),
)
For Sentry, in addition to Sentry tools, we enabled direct event lookup from URLs—paste a Sentry link and get the full JSON:
eventTool := mcp.NewTool("get_sentry_event",
    mcp.WithDescription("Get event by URL or ID - paste Sentry event URL to fetch full JSON"),
    mcp.WithString("event_url_or_id", mcp.Description("Sentry event URL or event ID")),
)
Deploying with Heroku Managed Inference and Agents
Heroku Managed Inference and Agents provides an MCP gateway that handles the SSE transport layer, letting you deploy MCP servers as simple STDIO processes.
Create app, attach Add-on, configure, and deploy:
heroku create your-observability-mcp
heroku addons:create heroku-inference:claude-4-5-haiku -a your-observability-mcp
# Set credentials for your observability platform
heroku config:set YOUR_PLATFORM_CREDENTIALS -a your-observability-mcp
# Deploy
git push heroku main
Get the inference token:
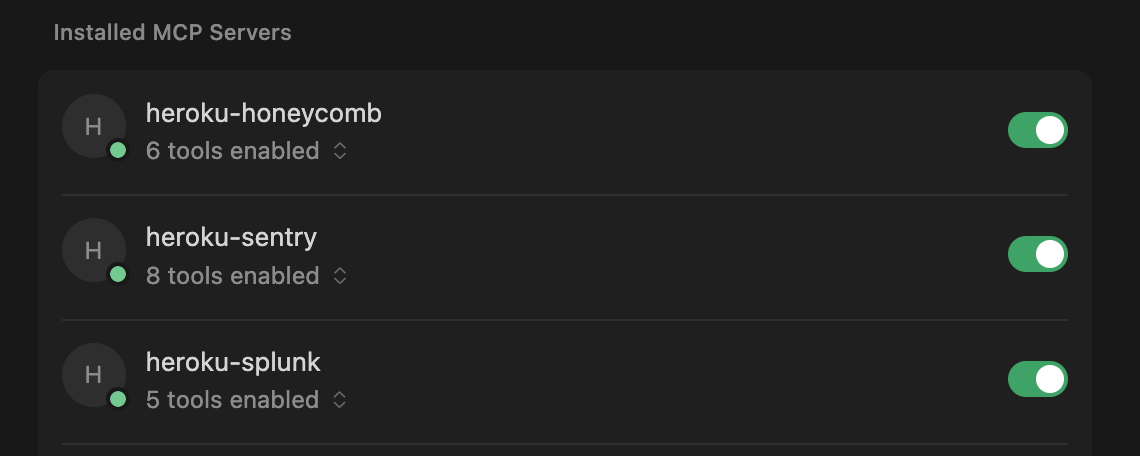
heroku config:get INFERENCE_KEY -a your-observability-mcpTeam members add this to their Cursor or Claude configuration:
{
  "mcpServers": {
    "splunk": {
      "command": "npx",
      "args": ["-y", "mcp-remote", "https://us.inference.heroku.com/mcp/sse",
               "--header", "Authorization:Bearer YOUR_INFERENCE_TOKEN"]
    }
  }
}
Contextualizing error spikes
In a traditional dashboard, you see a red bar. With MCP, you get an answer. We asked the agent, “What error types are most common in production today?” and it returned the ranked list below.
| Rank | Error Type | Count | Primary Source |
|---|---|---|---|
| 1 | TimeoutException | 847 | checkout-service, payment processing |
| 2 | ConnectionRefused | 312 | database pool exhaustion, redis |
| 3 | NullPointerException | 156 | user-profile-api, missing field handling |
| 4 | RateLimitExceeded | 98 | external-api-gateway, third-party calls |
| 5 | AuthenticationFailed | 67 | session-service, expired tokens |
| 6 | ResourceNotFound | 54 | inventory-api, stale cache references |
| 7 | CircuitBreakerOpen | 41 | payments-api, downstream failures |
| 8 | DeserializationError | 28 | webhook-processor, malformed payloads |
While the distribution might look standard, the AI can help you interpret the security implications. For example, the AI can correlate a rise in AuthenticationFailed errors with specific geographic regions to confirm a brute-force attempt or credential attack, or identify that RateLimitExceeded errors are coming from a single subnet. This context transforms a generic “error count” into actionable security intelligence.
Why AI-native observability changes the game
Connecting your observability stack to your IDE via MCP does more than just save you a few clicks; it keeps you in the flow during an incident. By letting Heroku Managed Inference and Agents handle the proprietary query syntax, any engineer can interrogate production data as easily as a platform specialist. Why this works better:
- Automate complex security audits: We processed 175,000+ events in minutes to clear a suspicious account flag, turning hours of manual log analysis into a single natural language question.
- Bypass the syntax barrier: Engineers ask questions in natural language instead of wrestling with complex SPL or Honeycomb queries. No one needs to remember platform-specific syntax at 2 AM.
- Deploy “Day One” observability: New hires can query production state immediately without mastering your specific observability stack or acronyms. The AI translates intent into execution.
- Debug directly in context: Stop toggling between IDE and browser. By pulling telemetry into your local environment, you keep your mental model intact and fix issues where the code lives..
- Instant root cause analysis: Simply paste a URL to get an immediate root cause analysis with suggested fixes, skipping the manual correlation step entirely.
Extend your AI assistant with any API
Moving from siloed observability tools to an AI-integrated debugging workflow requires bridging the gap between platforms and your IDE. We built this using Heroku Managed Inference and Agents and the Model Context Protocol, and the same pattern works for any API you want to bring into your AI assistant.
Whether it’s observability, internal tools, or customer data — if you can call an API, you can expose it as an MCP tool. Heroku Managed Inference and Agents handles the transport, authentication, and hosting. You focus on the integration.
What will you build? Get started with Heroku Managed Inference and Agents