Modern applications on Heroku don’t just consist of code. They are living ecosystems comprised of dynos, databases, third-party APIs, and complex user interactions. As these systems scale, so do the logs and metrics. To efficiently extract the signals from the noise you need to understand system health in the context of external factors, like resource limits . While Heroku removes the pain of managing servers, observability is critical for monitoring service interactions and performance optimization.
Maintaining peak performance and operational health demands sophisticated logging and monitoring capabilities. However, a common friction point remains: the “swivel-chair” workflow. The necessity of frequent toggling between application source code, deployment activity logs, and disparate monitoring dashboards creates significant cognitive load. When you are diagnosing a critical production error, every second spent correlating a timestamp from a log file to a spike on a separate metrics dashboard is a second lost.
To resolve this fragmentation, SolarWinds Papertrail powered by SolarWinds and Heroku have expanded the SolarWinds Papertrail add-on. By delivering logs and metrics into a single, unified solution, we are helping developers streamline troubleshooting and dedicate more time to writing high-quality code.
The high cost of context switching: Where traditional monitoring fails
Before we dive into the solution, it is worth dissecting the problem. In a traditional Heroku setup, a developer might rely on heroku logs –-tail for real-time events, a separate add-on for performance graphs, and perhaps a third tool for uptime alerting.
This fragmentation results in several operational inefficiencies:
- Correlation blindness: If your application throws a 500 error, was it caused by a memory leak, a database lock, or a bad deployment? Finding the answer requires manually matching the timestamp of the error log with the timestamp of the CPU spike on a different screen.
- Alert fatigue: When metrics and logs are siloed, alerts lack context. A “High CPU” alert is useless without the accompanying log lines that tell you what process was consuming that CPU.
- Tool sprawl: Managing multiple subscriptions, API keys, and dashboards increases administrative overhead and costs.
The cognitive load required to diagnose a production error is often higher than the complexity of the fix itself. This is where the unified SolarWinds Papertrail add-on changes the game.
The solution: One interface for logs and metrics
To simplify and consolidate your application’s observability stack, SolarWinds Papertrail has been extended to replace the functionality previously delivered by separate add-ons. The enhanced SolarWinds Papertrail add-on combines real-time log management, metrics dashboards, and alerting into a single, unified offering.
This consolidation provides a single pane of glass for all aspects of your application’s health. By bringing these capabilities under one roof, we eliminate the high cost of context switching.
Core components of the unified architecture
SolarWinds Papertail’s unified architecture isn’t just about moving data; it’s about transforming raw logs and metrics into actionable insights. By layering different types of operational data, we tell a complete story and eliminate the traditional barriers to speed.
Eliminate data lag with real-time unified ingestion
SolarWinds Papertrail’s signature feature has always been frustration-free log management. It allows you to tail and search logs as they happen. Real-time means real-time. There is no waiting for batches to process or indexes to update.
- Live tail: Watch events stream live, identical to the CLI experience but with powerful filtering and highlighting.
- Contextual search: Access your logs via a web browser, command-line interface (CLI), or API with the same effortless search format.
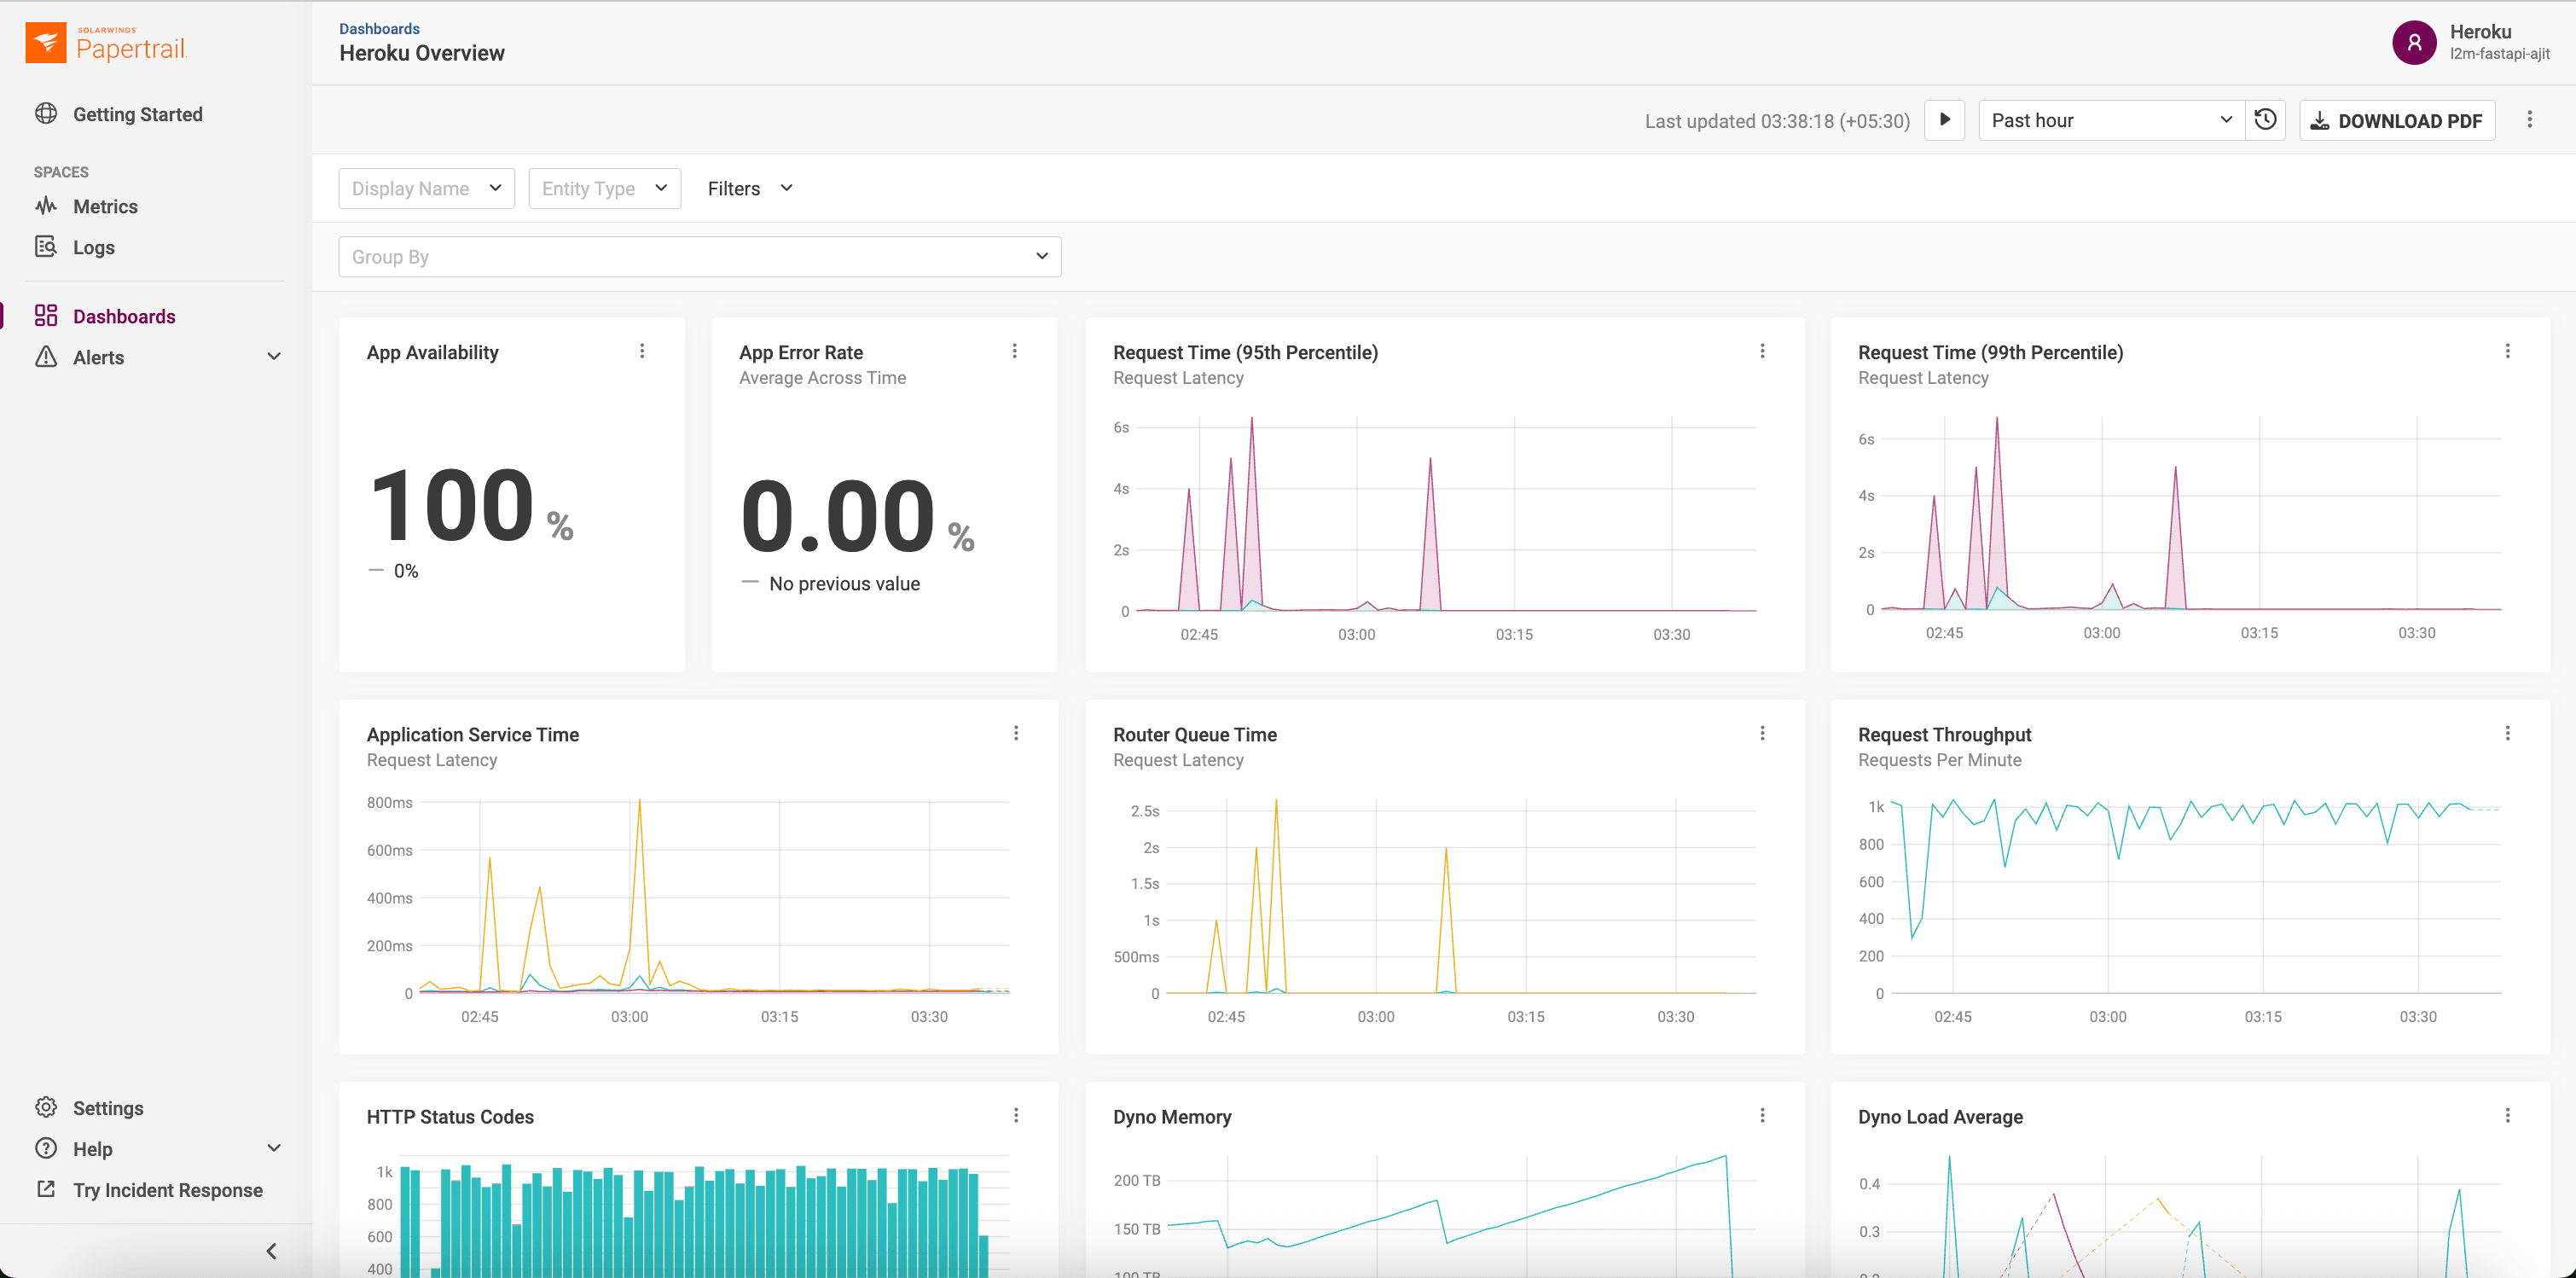
Gain instant visibility through native Heroku metrics
Instead of requiring a separate agent or complex configuration, SolarWinds Papertrail leverages Heroku’s native capabilities. It automatically ingests high-volume log data and structures it into actionable metrics.
- Dyno performance: Visualize CPU load, memory usage, and load averages per dyno.
- Application health: Track throughput, response times, and error rates.
- Data services: Monitor critical database performance including active and waiting connections, database size, cache hit rates, and IOPS to prevent connection saturation and storage bottlenecks.
When you view these metrics alongside your logs, the shape of your traffic becomes visible. A sudden dip in log volume might indicate a silent failure where requests aren’t reaching the server, while a massive spike could signal a DDoS attack or a runaway loop.
Cut through the noise with context-aware alerting
Alert fatigue is a real threat to operational excellence. If everything is an emergency, nothing is. The expanded SolarWinds Papertrail toolset moves beyond basic error counting to intelligent alerting.
You can now set granular, custom thresholds using minimum, maximum, average, or summary values on any metric. This allows you to filter out transient noise and focus on statistically significant deviations.
When a true issue is detected, the system integrates seamlessly with the tools you already use, pushing actionable notifications to Slack, PagerDuty, Microsoft Teams, and more.
Scale your team’s expertise with institutional memory
One of the most underrated challenges in growing development teams is the loss of troubleshooting context during handoffs or scaling. SolarWinds Papertrail addresses this by treating every saved search and custom alert as institutional memory.
Because all Heroku collaborators can contribute to a shared library of diagnostic tools, the platform accumulates your team’s collective expertise. A complex search query written to diagnose a specific race condition today doesn’t vanish into a terminal history; it becomes a reusable diagnostic tool for a junior developer tomorrow.
The 2:00 AM test: From fragmented logs to near-instant resolution
To understand the practical impact, let’s look at a common scenario. The incident: It is 2:00 AM. Your PagerDuty triggers an alert: “API Response Time High.”
The old way
You wake up, log into your metrics dashboard, and see a spike in response time starting at 1:55 AM. You then open your logging provider and try to search for logs from that timeframe. You are scrolling, trying to mentally overlay the graphs with the text. You see some database errors but aren’t sure if they are the cause or the symptom.
The SolarWinds Papertrail way
You click the link in the PagerDuty alert. It takes you directly to the SolarWinds Papertrail dashboard, focused on the 1:55 AM timeframe.
- Top view: You see the “Response Time” graph spiking.
- Bottom view: Directly underneath, you see the log stream for that exact moment.
- Diagnosis: You notice a specific background worker (
Dyno worker.1) outputting “Out of Memory” errors (R14) right as the latency spiked. - Resolution: You identify that a specific batch job was consuming too much RAM. You restart the dyno and push a fix to optimize the job.
Total time? Minutes, not hours. The correlation was instant because the data was unified.
Migration: Simplifying the stack
Other SolarWinds add-ons, Librato and AppOptics were deprecated at the end of January 2026. For teams previously relying on separate add-ons like Librato or AppOptics, the path forward is now significantly streamlined. Managing distinct subscriptions and dashboards for logs versus metrics is a relic of the past now that we’ve brought metrics into SolarWinds Papertrail.
Accelerate development and minimize headaches with SolarWinds Papertrail
Modern development isn’t just about shipping code. It’s about owning the lifecycle of that code in production. The SolarWinds Papertrail add-on for Heroku offers a path away from fragmented, frustration-filled troubleshooting toward a streamlined, full-stack view of your application’s health.
By consolidating logs, metrics, and alerting into a single, frustration-free interface, you regain the focus required to build what’s next.
Ready to streamline your workflow? Find SolarWinds Papertrail in the Heroku Elements Marketplace today.