Modern cloud-native architectures are composed of multiple microservices running across dynamic environments. Effectively diagnosing performance issues, bottlenecks, or failures requires comprehensive observability. For this, many organizations look to OpenTelemetry, which provides a standardized approach to capturing and analyzing telemetry data.
Fir is Heroku’s next generation cloud platform, designed to offer more modern cloud-native capabilities with flexibility and scalability. It’s built on proven, open-source technologies. Traditional Heroku relied on proprietary technologies, which was appropriate at the time because high-quality open-source alternatives didn’t exist. But now, technologies like Kubernetes and OpenTelemetry are considered best-in-class solutions that are widely deployed and supported by a vast ecosystem.
Kubernetes is at the core of Fir’s infrastructure, providing automated scaling, self-healing, and efficient resource management. And while Kubernetes powers Fir, end users are not exposed to it directly—which is a good thing, since Kubernetes is very complex. Under the hood, Fir takes advantage of the powerful capabilities of Kubernetes, but it only exposes the user-friendly Heroku interface for user interaction.
OpenTelemetry offers standard-based visibility into how applications and services interact within Fir as well as integrate with external systems. By leveraging OpenTelemetry with Fir, developers can gain deep insights into application performance. They can track distributed requests and even route telemetry data to external monitoring platforms if they wish.
Let’s look more deeply into OpenTelemetry and what it brings to the table.
Understanding OpenTelemetry
As an observability framework, OpenTelemetry is designed to standardize the collecting, processing, and exporting of telemetry data from applications. It aims to provide a unified approach to capturing this data across distributed systems so that developers can monitor performance and diagnose issues effectively.
One of the primary goals of OpenTelemetry is to eliminate vendor lock-in. You can send telemetry data to various backends, such as Prometheus, Jaeger, Grafana, Datadog, and—of course—Heroku, without modifying application code.
OpenTelemetry consists of language-specific APIs and SDKs coupled with the OpenTelemetry Collector, all working together to provide a unified observability framework. The APIs define a standard way to generate telemetry data, while the SDKs offer language-specific implementations for instrumenting applications. The OpenTelemetry Collector acts as a processing pipeline. It supports the ingestion, filtering, and export of telemetry data using the OpenTelemetry Protocol (OTLP), which standardizes the transmission of data to various observability backends.
OpenTelemetry supports three primary telemetry data types, each serving a critical role in observability:
- Logs capture discrete events, such as errors or system messages, providing a detailed record of application behavior.
- Metrics track numerical data over time, offering quantifiable insights into system performance.
- Traces track the flow of requests across distributed services, enabling developers to diagnose latency issues and optimize performance.
Fir: Heroku’s next generation platform
By integrating Kubernetes into its core, Fir empowers developers to deploy and manage applications with greater control and resilience. Leveraging Kubernetes ensures that applications can handle varying workloads seamlessly, adapting to changing demands without manual intervention. Because it runs specifically on top of AWS EKS, Fir can take advantage of more diverse and powerful instance types, such as the AWS Graviton processor.
Fir utilizes Open Container Initiative (OCI) images and Cloud Native Buildpacks to package and deploy services and applications. This is a major improvement, because it means developers in the Heroku world can tap into their standards-based knowledge and tooling. In addition, Fir integrates seamlessly with OpenTelemetry, providing a built-in collector and easy ways to configure drains for transmitting telemetry data to additional destinations if needed.
Basing Fir on open-source standards and technologies is a major advantage for several reasons:
- If a company already uses these technologies and has a centralized observability platform, then they can gradually migrate some systems to Fir, while retaining a single pane of glass for all systems.
- It avoids lock-in because companies can easily migrate to other Kubernetes providers and still use their existing OpenTelmetry instrumentation and CNB pipelines.
- Companies have the option of maintaining a hybrid environment, in which some systems run on Heroku Fir while others run on other Kubernetes providers if they need more control.
The benefits of OpenTelemetry in Fir
Native integration with OpenTelemetry means Fir enables automatic telemetry collection without requiring extensive manual setup.
By tracing requests across distributed services (including on non-Heroku systems interacting with Fir), developers can easily pinpoint failures and optimize system performance. These capabilities enable teams to proactively address issues before they impact end users, improving application reliability.
OpenTelemetry’s vendor-agnostic approach gives organizations the flexibility to choose their preferred monitoring and analytics tools. Since OpenTelemetry is an open-source project, it benefits from continuous improvements and broad community support.
Because of its lightweight and distributed architecture, OpenTelemetry is well-suited for large-scale, cloud-native environments like Fir’s Kubernetes-based infrastructure. It efficiently handles high-volume telemetry data, ensuring that performance monitoring scales alongside the application.
How does OpenTelemetry work with Fir?
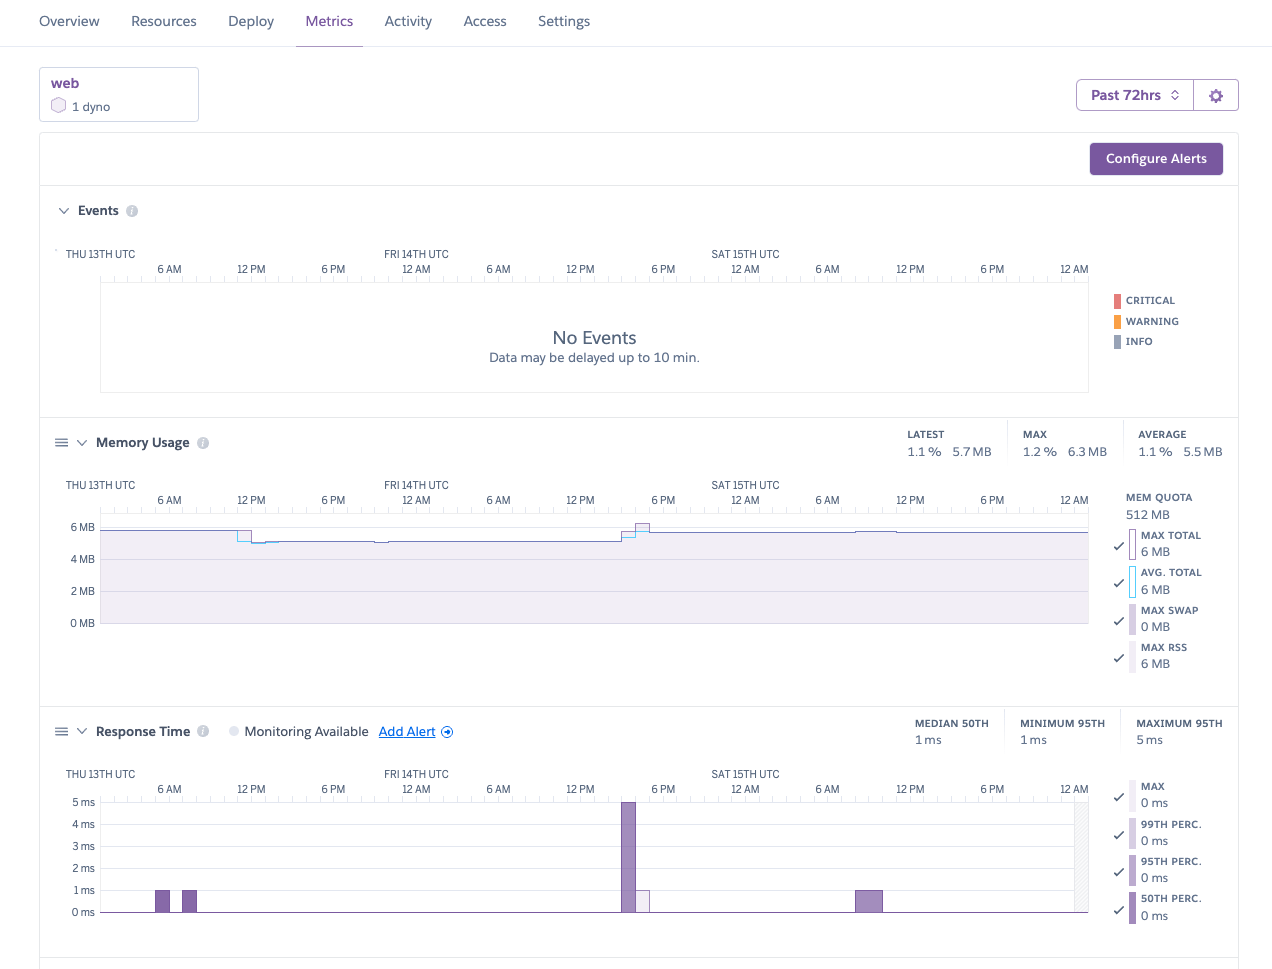
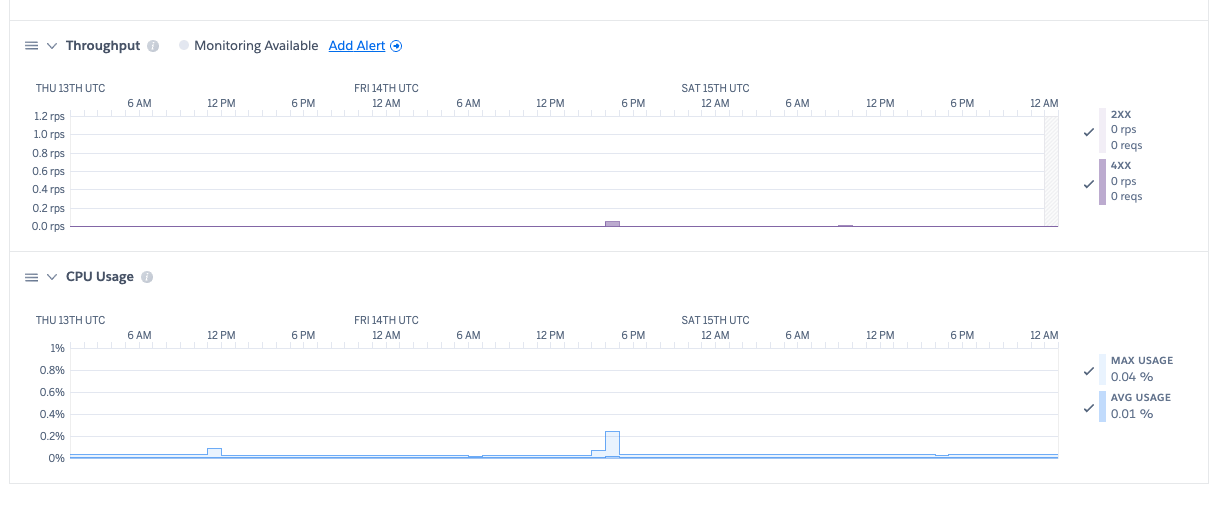
Fir provides out-of-the-gate OpenTelemetry logs and metrics for your dynos and the applications running on them. These are displayed in your app’s dashboard.
You can take this even further. If you configure an OpenTelemetry SDK and instrument your application, then you can generate custom metrics and distributed traces. You can also configure drains to send your telemetry data to third-party observability platforms.
How do all the pieces fit together? Consider the following diagram:
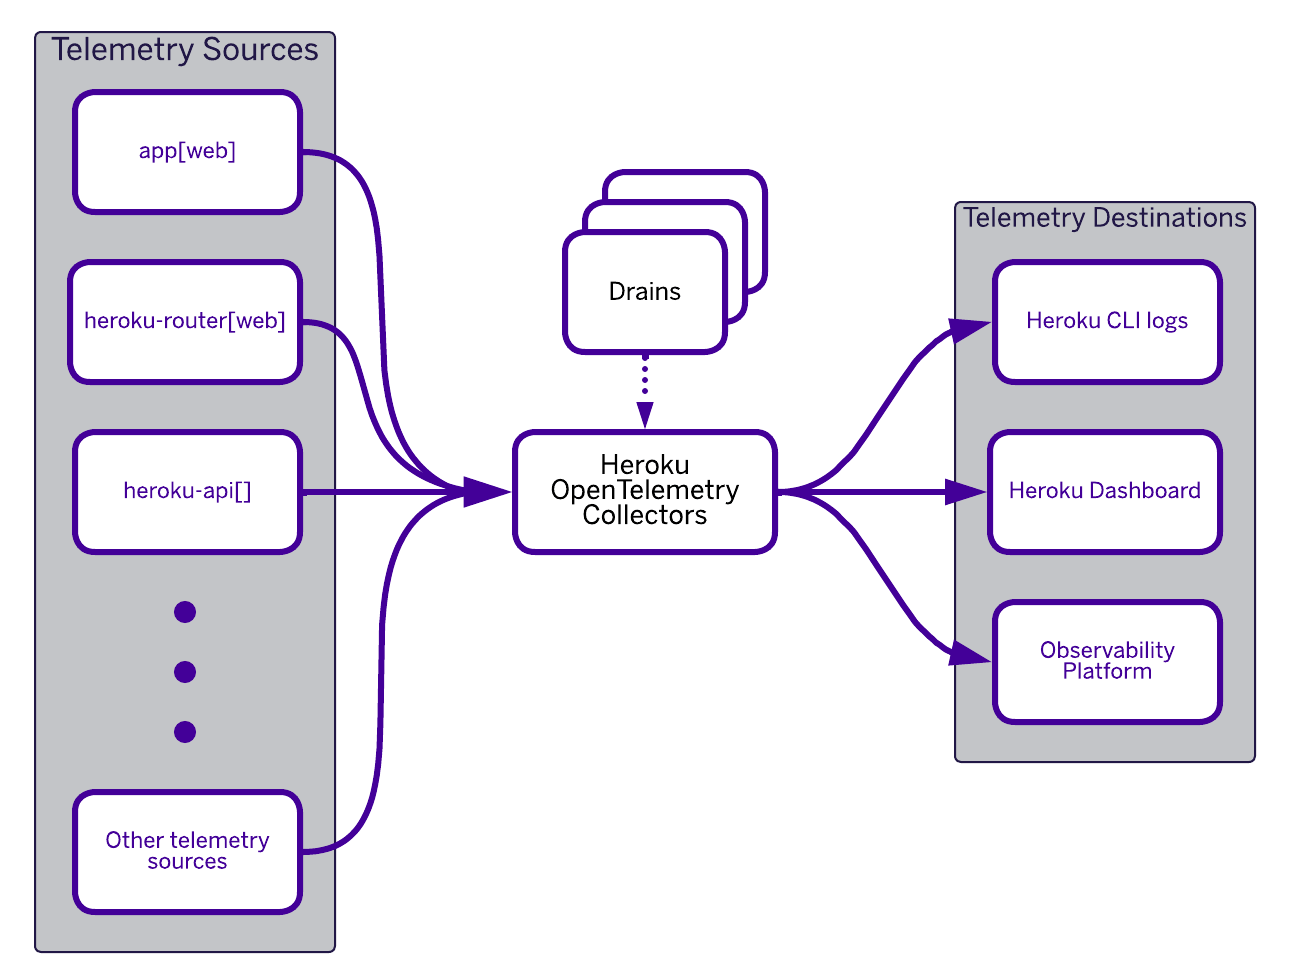
The built-in Heroku OpenTelemetry Collector does all the heavy lifting for you.
- Fir uses the Heroku OpenTelemetry Collector to collect data from various telemetry sources such as your web application, the Heroku router, and the Heroku API.
- The collector is configured with various telemetry destinations (drains).
- The collector sends the relevant telemetry data to destinations like Heroku CLI logs, the Heroku dashboard, or other observability platforms.
OpenTelemetry drains can be defined at the space level—meaning they apply to all applications in the space—or at an individual application level. This is done using the Heroku CLI:
$ heroku telemetry -h
list telemetry drains

USAGE
  $ heroku telemetry [-s ] [--app ]

FLAGS
  -s, --space=  filter by space name
  --app=        filter by app name

DESCRIPTION
  list telemetry drains

EXAMPLES
  $ heroku telemetry

COMMANDS
  telemetry:add     Add and configure a new telemetry drain. Defaults to collecting all telemetry unless otherwise specified.
  telemetry:info    show a telemetry drain's info
  telemetry:remove  remove a telemetry drain
  telemetry:update  updates a telemetry drain with provided attributes (attributes not provided remain unchanged)
The key to the interoperability of Heroku’s telemetry data is the Open Telemetry Protocol (OTLP). This protocol has two transports: gRPC and HTTP. Heroku supports both. While the gRPC transport is more efficient and has more features (HTTP/2 streaming, bi-directional streaming, Protocol Buffers payload), it might not be able to traverse some firewalls or be routed properly. In these cases, the HTTP transport, based on simple HTTP 1.1, may be the best option. It may depend also on the support in the SDK of your programming language.
Conclusion
As cloud-native applications become more complex and distributed, observability is no longer optional. It is a fundamental requirement for ensuring reliability, performance, and rapid debugging. OpenTelemetry is quickly becoming the industry standard for telemetry collection, and its seamless integration into Fir ensures that applications running on the platform can be monitored with minimal effort.
Fir’s underlying Kubernetes foundation allows organizations to benefit from industry-leading infrastructure without needing to manage the complexity of Kubernetes directly. This combination provides a powerful and future-proof platform that simplifies operations while ensuring full visibility into application behavior.
Fir’s reliance on open standards and technologies is a win-win because it reduces the risk of vendor lock-in for users and also benefits from the development effort of the open-source community to enhance and improve those technologies.